In the age of data overload, making sense of complex information is more important than ever. Our Data Visualization Tools help businesses bring their data to life through intuitive, interactive visuals — making it easy to explore trends, uncover patterns, and make faster, smarter decisions.
With our Data Visualization Tools, your business can turn raw information into insight, insight into action, and action into measurable growth.
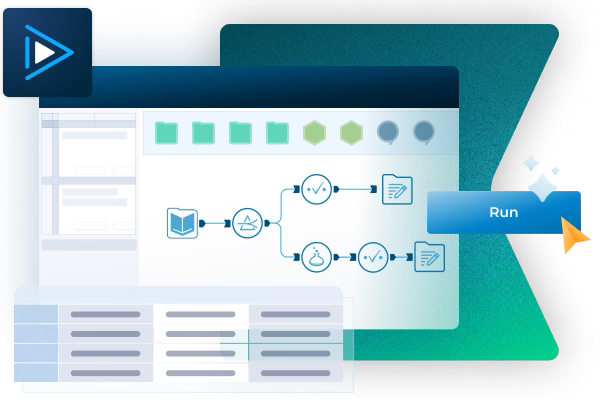
Interactive Dashboards
Drag-and-drop widgets, filters, and visual drill-downs let users explore data from every angle — no coding required.
Custom Charts & Graphs
Pie charts, bar graphs, scatter plots, heatmaps, treemaps, and more — tailored to your industry and audience.
Real-Time Data Updates
Automatically sync dashboards with live data feeds from APIs, CRMs, ERP systems, and databases.
Cross-Device Compatibility
Access your dashboards from desktop, tablet, or mobile — anytime, anywhere.
Data Layering & Segmentation
Compare datasets, segment by region or user behavior, and track KPIs across multiple variables.
Exportable Reports
Generate and share PDF, Excel, or presentation-ready reports for internal teams or clients.
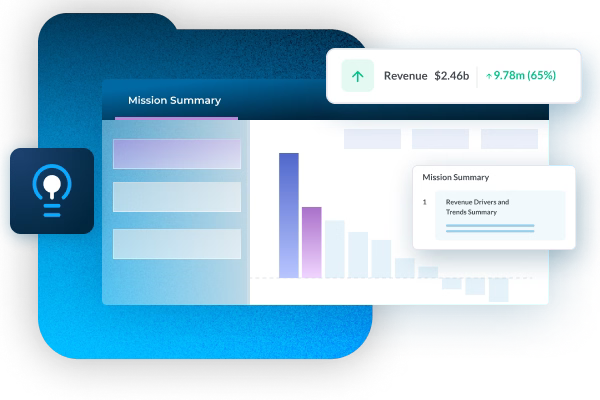
Transform Raw Data into Clear, Actionable Insights
From real-time dashboards to custom-built reports, we deliver visual interfaces that turn spreadsheets and raw metrics into stories your team can act on. Whether you’re tracking sales, monitoring customer behavior, or analyzing market performance, our visualization tools simplify complexity and amplify clarity.
What You Can Achieve
Quickly Identify Trends – See what’s working, what’s changing, and where to focus
Enable Data-Driven Teams – Make insights accessible to every department, not just data analysts
Monitor KPIs in Real Time – Track business-critical metrics with live updates
Simplify Complex Analysis – Turn large datasets into clear visual stories
Improve Reporting Efficiency – Automate and streamline reporting processes
Make Smarter Decisions, Faster – Empower leadership with clear, compelling data narratives
Popular Use Cases
Marketing Teams – Campaign performance, channel ROI, and audience segmentation


")